Recently, I spent a good portion of my morning debating with a homeowner why our recent appraisal of his home was less than Zillow's value. The mere fact that I was even having that conversation nearly had me banging my head against the nearest wall. The idea that a homeowner was putting so much stock in a free instant valuation off the Internet was unbelievable and frustrating. I whole-heartedly thought that at any moment the likes of Ashton Kutcher would jump out from behind my desk yelling "You've been Punked!".
As appraisers, we should understand how Zillow calculates its values, so we can intelligently discuss the differences in our value when compared to a Zestimate. On the Zillow website, under the heading, "How do we come up with the Zestimate," Zillow states it takes "zillions of data points" and enters them "into a formula." This formula is referred to as "a proprietary algorithm - a big word for secret formula". Well, let's see if we can decode this "secret formula".
In the following two examples, I reviewed several recent real estate sales in two different locations in Kane County and compared these Sales to Zillow's value estimates.
Example 1
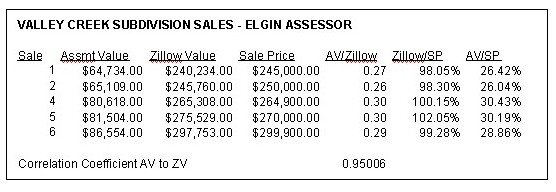
The last seven sales in the Valley Creek subdivision were reviewed. All sales except Sale 3 appeared to be an arms-length transactions. Sale 3 was a foreclosure sale. Zillow could not find Sale 7 because this property was new and did not have a current assessed value or Assessment information. This is our 1st clue...Zillow can't calculate a value unless there is assessment data. Both Sale 3 and Sale 7 were eliminated from this analysis. Below is a comparison of the Assessed Value (AV) of each of the five remaining sales to the Zillow Value (ZV).
The calculated Correlation Coefficient indicates how much one string of data correlates to another. A perfect correlation is 1. Any number close to 1 indicates a very high degree of correlation. The indicated coefficient that compares Zillow's Value to the Assessor's Value is a .95 which indicates that Zillow's values are highly correlated with the Assessor's values (Clue #2).
Note: In this example, Zillow's Values are very close to the actual sales prices (within 2% +/-). This is Clue #3 - I will address the reason for Zillow's accuracy later in this article.
Example 2
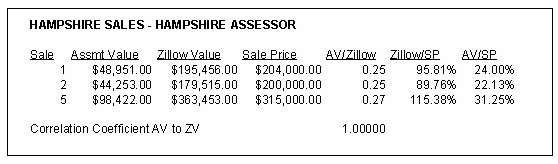
Our 2nd example is of the last six sales in the small town of Hampshire. Again, Zillow could not find the new homes (3, 4, and 6). Zillow found the existing home sales 1, 2, and 5 which are analyzed below.

The above comparison of Assessed Values to Zillow Values shows a correlation coefficient of a perfect 1. How interesting! Notice how the Zillow/SP column mirrors the AV/SP (i.e. Low Zillow/SP = low AV/SP or High Zillow/SP = high AV/SP) This is Clue #4.
Note: In this sample, Zillow was less accurate. In the case of Sale 1, it was only off by 4% but in the case of sales 2 and 5, Zillow was off by 10-15%.
Calculation of the Zestimate
The above examples give us some indication of how Zillow arrives at its value estimates (or Zestimate). Quite simply, the Zestimate relies on a calculated relationship of assessed value to sale price. Zillow merely takes selected transactions and calculates the relationship between the Assessed Values and the Sales Prices. It then applies that ratio to the subject's assessed value (plus or minus some adjustments) and "voila", you have Zestimate!
The above examples show that even when Zillow has a large margin of error in its Zestimate of 10-15%, the Zestimate is still highly correlated with the Assessor's Values. We can conclude from this analysis, that the Zestimate is a derivative of the Assessor's Values. Zillow may be slightly modifying the data by some weighting or factor like time or distance. That "tweaking" of the data could be the "secret" part of its formula. Still, clearly, the Zestimate is based on the underlying Assessor's Values as indicated by the high correlation coefficient.
Accuracy of the Zestimate
Notice how the Zestimates were actually quite accurate in Example 1 (within 2%), but in Example 2, the Zestimate varied by as much as 10-15% from the actual sales prices. This raises the question "Why was Zillow so much more accurate in Elgin?"
The reason Zillow was so accurate in Elgin (Valley Creek), but missed the mark in Hampshire is directly related to the Assessor's accuracy. This is no reflection on the assessor's competency, but rather the amount and quality of the data. In the case of Valley Creek, the Assessor has an abundance of data to draw from. This particular subdivision has an active market with short marketing time and many transactions of similar homes. The local Assessor usually gets it right with regards to values in this particular subdivision. In Hampshire, the data is not nearly as plentiful. This is a smaller community with far less homogeneity in the data and fewer transactions.
Also, notice how the direction of the variance was the same as the Assessor's variance to the Sales Price. In the cases were the Assessor's Values were low, say 22-26%, Zillow's values were low, and vise versa. This illustrates that when the Assessor may have over-valued a property, so does Zillow. We can conclude from this that Zillow is only as accurate as the local assessor. If the Assessor is wrong, so is Zillow. If the Assessor is right on...so is Zillow.
Since the folks at Zillow know the accuracy of its Zestimate is directly related to how well the Assessor gets it right, what better way to improve its own accuracy than to encourage homeowners to add information about their own homes to the Zillow site. Hopefully, the Assessor will take advantage of this free information to improve the accuracy of its assessed valuations; thereby, dramatically improving Zillow's accuracy. This is possibly the motivation behind Zillow's recent opening of its database up for input, in much the same way Wikipedia is an open database.
Conclusions
So if you chose to use Zillow, be aware of the flaws in its model. Understand that when you use Zillow, its accuracy is highly dependent upon the accuracy of the local Assessor. Even if you use Zillow's feature where you can choose your own comps, this will not necessarily improve accuracy unless, by pure chance, you chose comps that the Assessor more accurately assessed.
If in the future your appraisal is challenged on the basis of a Zestimate, hopefully you can more effectively deal that situation than banging your head on a wall and throwing Mr. Kutcher out of your office.